
November 12, 2026

During the most recent market turmoil, the S&P 500 Equal Weight Index moved from underperforming the S&P 500 Index by 4.54 percentage points in September to outperforming by 5.83 percentage points in October. The resulting 10.37 percentage point reversal was the largest in either direction across 441 monthly swings since 1990, registering a 4.9σ event. October itself was equal-weight’s strongest relative month in a decade as well.
Growing scrutiny of AI and data-center financing appears to have contributed to the shift from September’s technology-led rally to October’s drag. With nearly half of the S&P 500 Index concentrated in technology and communication services versus less than one-fifth for the S&P 500 Equal Weight Index, sector weights amplified the reversal.
Historically, when the Equal Weight index outperformed by at least 5% in a given month, it continued to outperform the following 12 months in three of the four cases (April 1999, December 2000, November 2002, April 2009). This suggests comparable equal-weight surges have appeared around major shifts in market leadership, including the dot-com unwind and post-financial-crisis recovery.
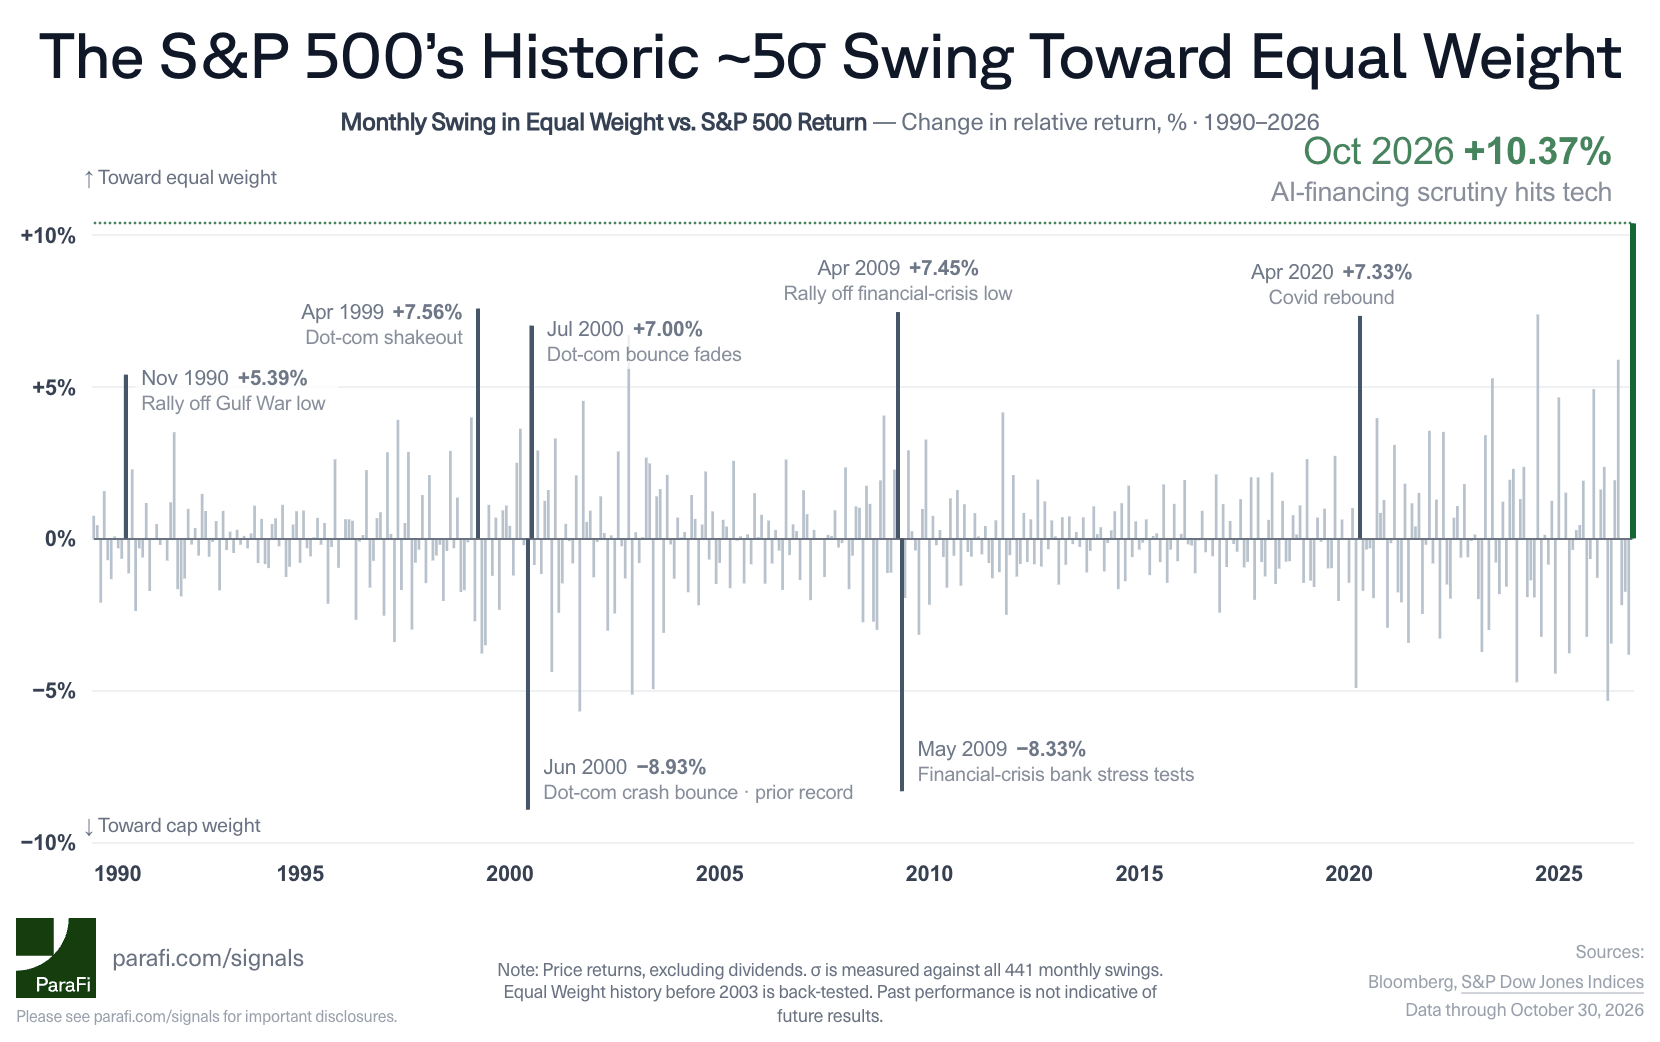
Note: Source: ParaFi analysis of Bloomberg month-end price levels for the S&P 500 Equal Weight Index (SPW) and the S&P 500 Index (SPX), December 1989 through October 30, 2026. Returns are price returns and exclude dividends. Relative return is the Equal Weight Index’s monthly return minus the S&P 500’s, in percentage points. The swing is the month-over-month change in that relative return; it is not a two-month holding-period return. The sample contains 442 monthly returns and 441 swings (February 1990–October 2026). The chart labels every earlier swing of at least 7 points in either direction except July 2024 (+7.37 points), which is left unlabeled for legibility, and also labels November 1990 (+5.39 points). Label captions name contemporaneous market events for context; they are not attributions of cause.
The 4.9σ figure is October’s swing (10.37 points) less the sample mean (0.01 points), divided by the sample standard deviation (2.10 points), with October 2026 included. The title rounds it to ~5σ. It is a descriptive standardized distance, not a probability or recurrence estimate. “Largest since 1990” refers to the history analyzed, which begins in December 1989; earlier history was not tested. October’s 5.83-point relative return ranks first of the last 120 months and second of all 442, behind April 2009 (9.17 points). The S&P 500 Equal Weight Index launched in January 2003; earlier values are back-tested index history.
The four prior months are those in which the Equal Weight Index’s monthly return exceeded the S&P 500’s by at least 5 percentage points. Forward performance is the Equal Weight Index’s cumulative price return minus the S&P 500’s over the following 12 months, excluding the event month: −9.0 points after April 1999, +11.2 after December 2000, +11.0 after November 2002 and +12.9 after April 2009. The sample is small, concentrated around the dot-com and financial-crisis periods, and descriptive only; relative performance is distinct from absolute market returns. Past performance is not indicative of future results. Figures are rounded. Chart data and methodology.
Important Disclosure: ParaFi Signals are provided solely for informational purposes and should not be construed as financial, legal, tax, or investment advice. The information provided above should not be considered a recommendation to purchase or sell any particular security. ParaFi and its affiliates may hold positions or other economic interests in the securities, digital assets, companies, protocols, or other assets discussed herein.
Any opinions or views expressed reflect the judgment of the author as of the date of publication and are subject to change without notice. Certain information has been obtained from third-party sources, including from portfolio investments of investment vehicles managed by ParaFi. ParaFi makes no representations or warranties, express or implied, as to the accuracy or completeness of the statements or any information made herein or through a ParaFi social media account and any liability therefore is expressly disclaimed. ParaFi makes no representations about the enduring accuracy of information, or its appropriateness for a given scenario, and expressly disclaims any obligation to update any information or statement.
Unless otherwise noted, all figures and calculations are estimated and rounded for ease of reference. Figures and calculations provided are for informational purposes only, computed by the speaker (or a third-party, if so disclosed), and have not been audited by any independent third party. You should independently evaluate and judge the matters referred to therein.